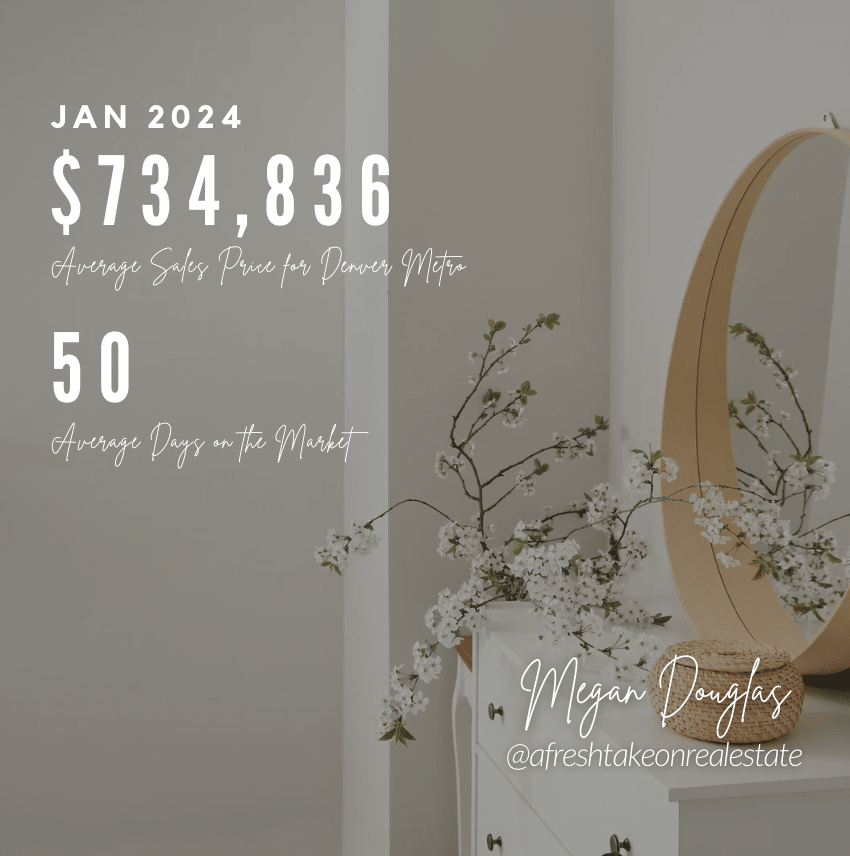

You’re Noticing Price Reductions and Homes Staying on the Market for Longer Than We’ve Seen in a While in Denver. What’s Really Going on and Is It Normal?
Let me start by saying that if Denver were to ever get to a place where listings stayed on the market for 30 days that would be considered a healthy market. Sellers prepare their homes for market, Buyers view the home and then have a night to sleep on it before submitting an offer, and less contracts fall through because Buyers and Sellers are on the same page. Sounds like a dreamland right? In Denver we’ve been operating on an excellerated timeline.
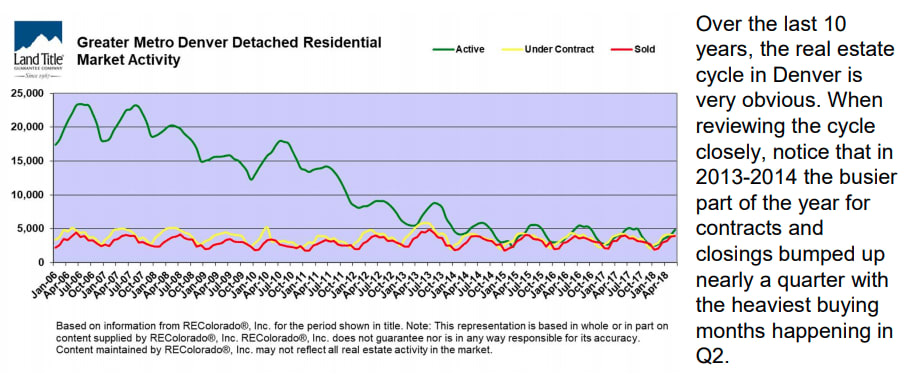
It’s no secret that the real estate market is hard to predict. You’ve heard the phrase from your realtor if I can just look into my crystal ball I can tell you…probably so many times you’re rolling your eyes reading this. But it’s true. We try to predict the amount of housing supply vs buyer demand and come up with trends that best represent our city. Denver’s particularly tricky because it’s growing so fast, appreciating so fast, interest rates are fluxuating, and the seasons and school year don’t regulate our market as significantly as they do in other cities. It feels like in the last two weeks the demand just went away…not true, but it did change and it changes every year. Take a look here specifically at the changes that occurred mid June to mid July 2014-2017. The Red is Sold, Yellow is Under Contract, and Green is Active houses. The closer the lines are together the more compeitive the market is:
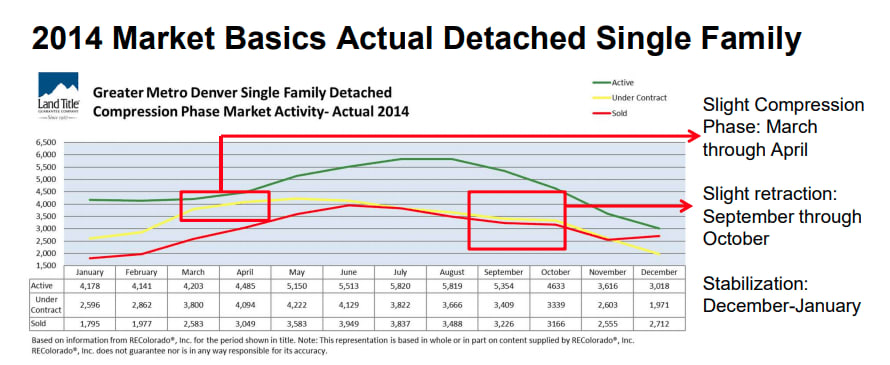
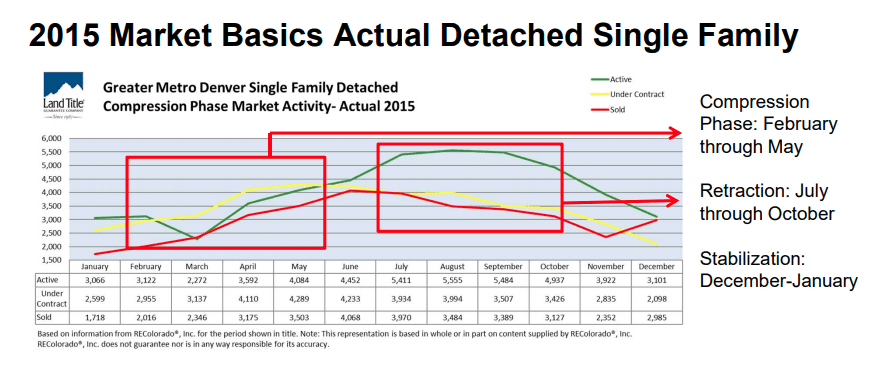
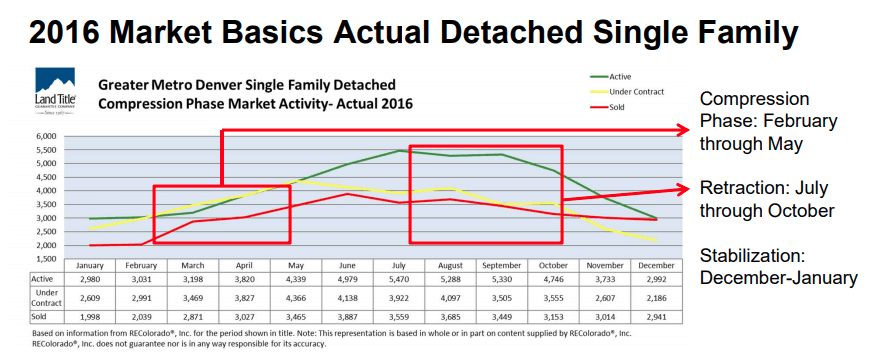
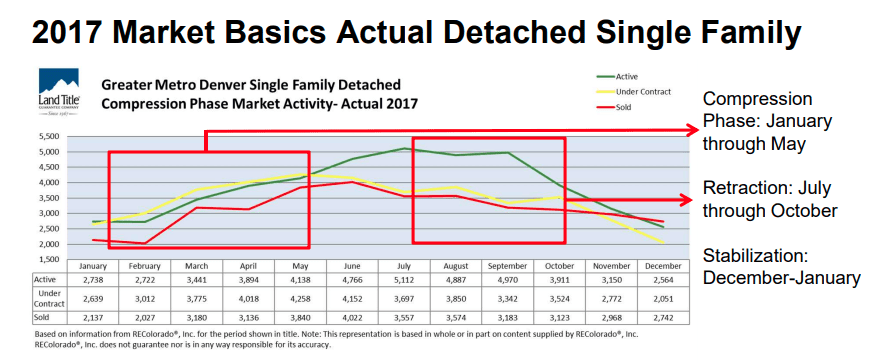
So you see each year since 2014 February through May has been a challenging time to be a Buyer. For homeowners this can be a great time to list where the buyer demand typically exceeds the listing supply. But by the time we reach June/July and homes continue to come on the market there gets to be a bit of a surplus. When that week hits is traditionally right after the 4th of July but this year it hit about two weeks before. The stats show that on years where the Broncos don’t play particularly well, that the real estate season starts earlier (Think of my phone ringing off the hook on New Years! Keep those referrals coming baby!) and then the retraction phase starts just a little early too. Additionally, the summer months are the months where kids are out of school and vacations are planned leading to a distracted potential buyer pool.
So, what are we looking like for 2018? Because that’s the question at hand right? If the same month over month transition happens in 2018 as we have seen over the last 4 years here’s what to expect:
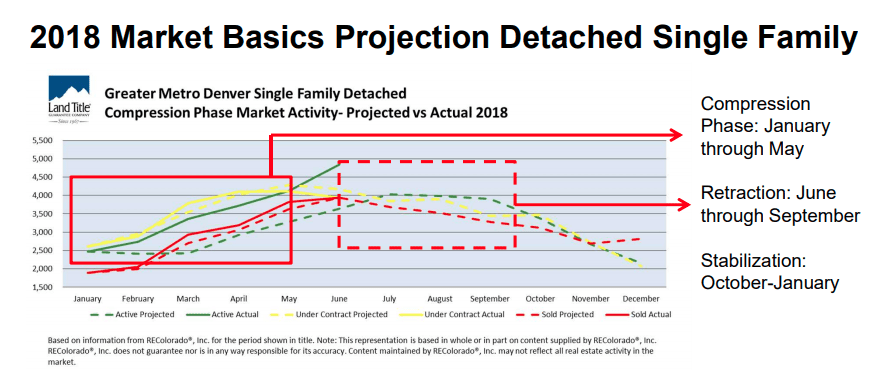
2018 Started as a Challenging Year for Buyers. Now We’re Seeing the Traditional and Seasonal Mid Year Retraction.
What Does That Mean for Denver Home Pricing? Great for Buyers but Hard for Sellers to Swallow in One of the Most in Demand and Moved to Cities in the Country.
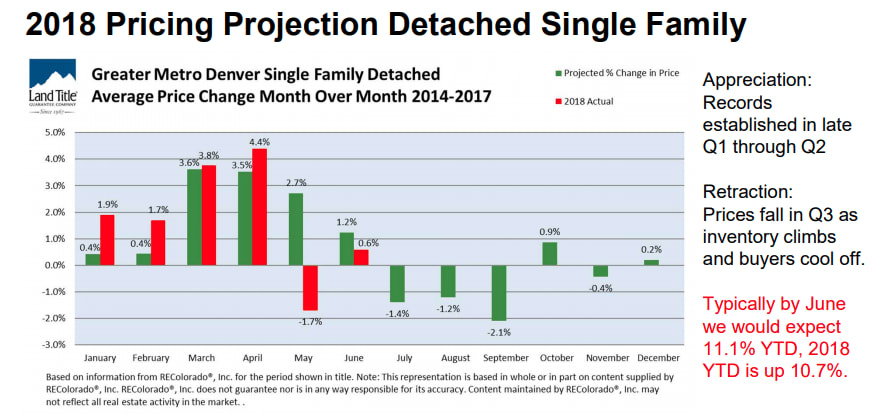
Now before you start talking about the b word for bbbbbuble. Lets remember that this has been happening year after year for quite some time. Yes there are ebs and flows like just about every other market but if predictions are correct Denver single family homes should appreiciate around 11% this year which for the average Denver homeowner is $59,400. Nobody is taking away the $59,400 in home equity you’re expected to earn this year, it’s just a consistent eb and flow like the waves on a beach, just let it happen.
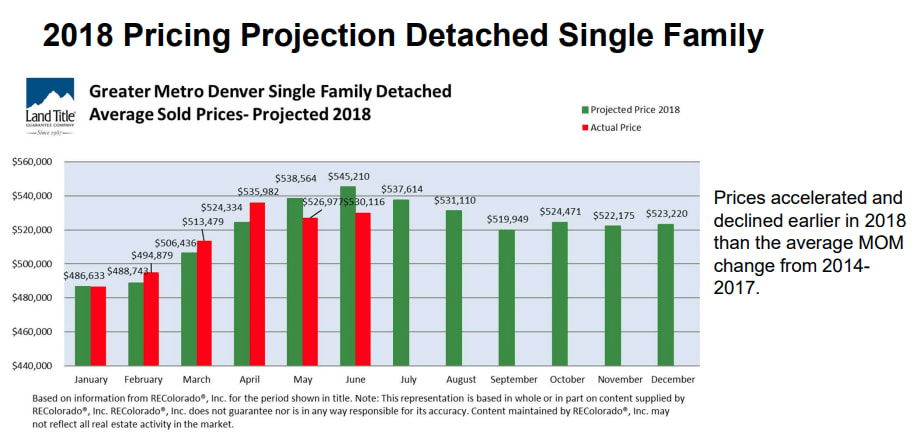
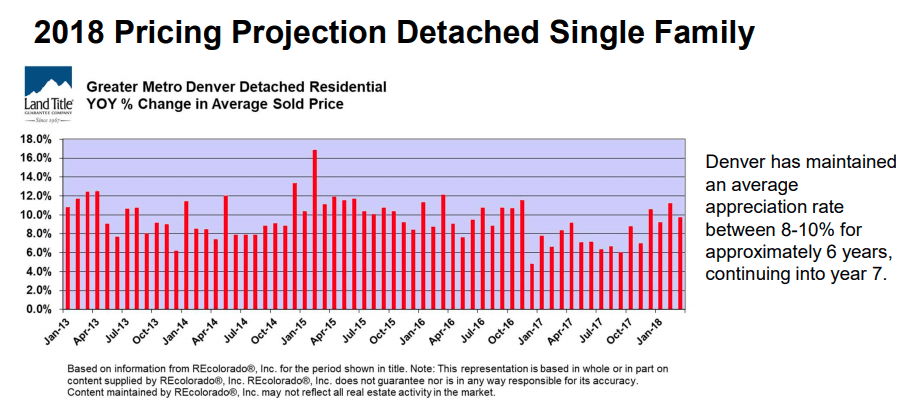
Why does 2018 feel so different from prior years? Well you see Denver exceeded every expectation set for its real estate market for 4 straight months. So that has to even out somewhere and it’s evening out just a bit this summer. Taking a step back to our big picture starting in Jan with average sold prices at $486K and ending December at $523K would still be an upwardly trending market. Denver has maintained an average appreciation rate between 8-10% for almost 7 years and we expect to continue that solidly into 8, 9, 10 years.
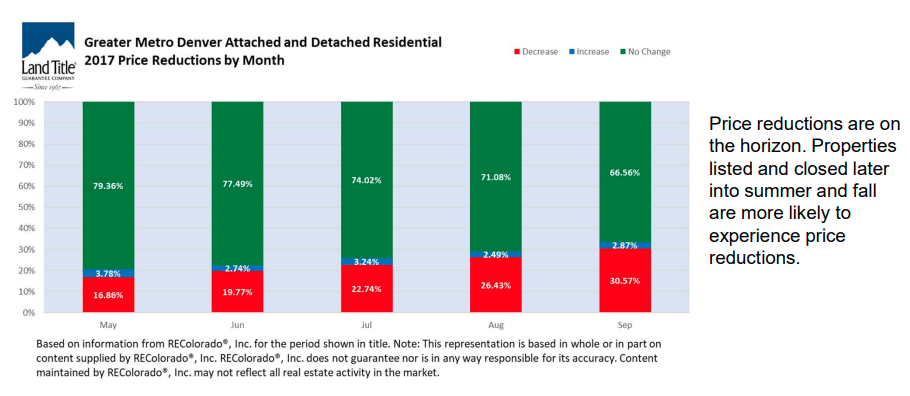
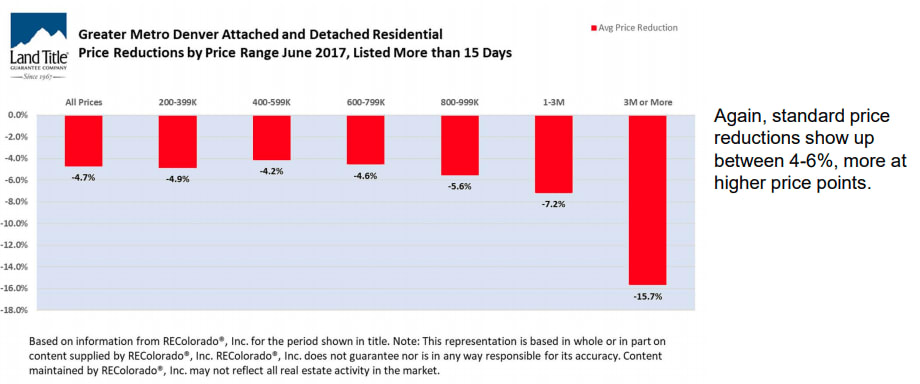
So lets take a look into my crystal ball (ha ha, I couldn’t resist) and chat about predictions for the second half of 2018. Properties listed and closed later into summer and fall are more likely to experience price reductions. See below for the average price reduction per price point. There’s nothing wrong with these homes. In our fast paced market times if a home is on the market for longer than 3 days Buyers think the roof must be falling in. But in these times the home is just finding it’s right price. So Buyers give those homes a chance, they could be your dreamhome!
I hope this mid year review and preditions for the remainder of 2018 are helpful. Additionally if you’re starting to think about what your real estate picture looks like in 2019 this historical infromation can help you prepare. If you have any questions about how these changes impact you as a Buyer or a Seller I’m happy to talk about your individual situation, please reach out.